Software
Download latest software
Please use this link to request the latest D-Flow and or GOAT software.
Gait Offline Analysis Tool (GOAT) explained
Watch this video to find out more about how to use the GOAT for analyzing your data.
Frequently Asked Questions GOAT
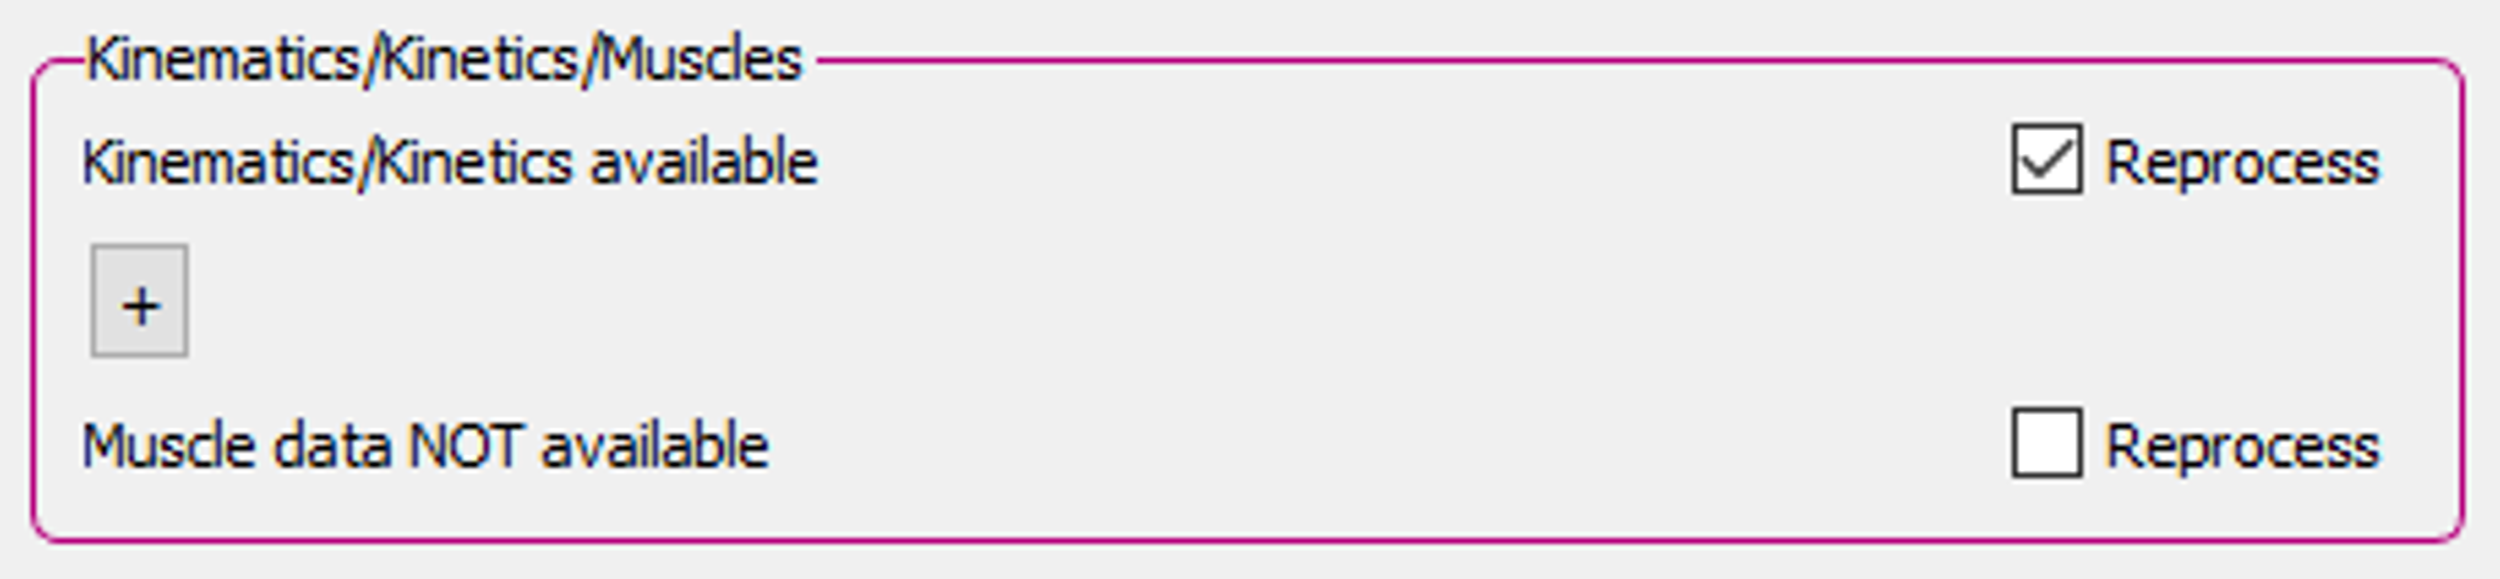
Q: I’m not able to visualize the stick figure, how is that possible?
A: In order to visualize the stick figure the kinematic and kinetic data should be reprocessed at least once in GOAT. During the reprocessing of data, the joint centers are calculated (again) in GOAT. These joint centers are needed for the stick figure. After reprocessing, save the file so reprocessing is not needed anymore.
Q: The 3D model visualization doesn’t match the marker data, is my data incorrect?
A: The Human Body Model has two separate pipelines, one for the inverse dynamics and one for the muscle visualization. Therefore, it is possible that the muscle visualization does not perfectly fit the marker data. If so, please check if the stick figure is correct. The stick figure is based on the inverse dynamics pipeline and therefore the visualization of the stick figure can give an indication whether the data is correct. If the stick figure is correct, then the kinematic, kinetic and muscle estimation data are correct and only the muscle visualization is off. If the stick figure shows a strange behavior, then the kinematic and kinetic data has the same strange behavior and then there might be something wrong with the data.
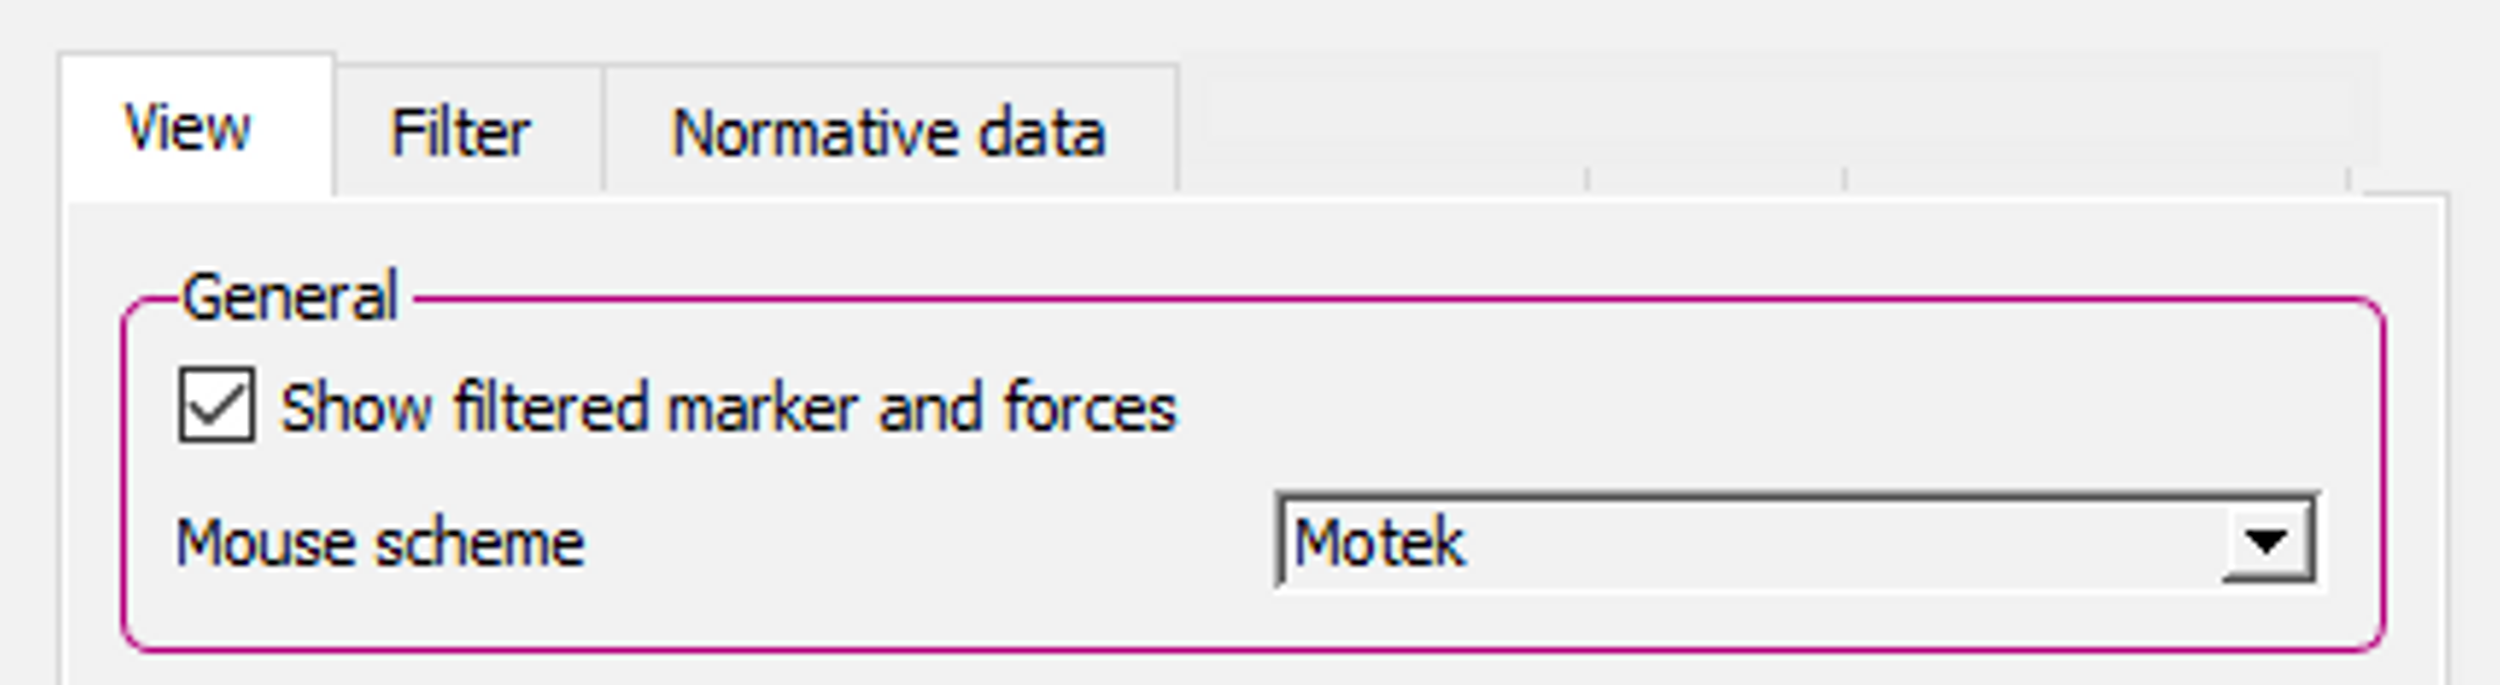
Q: The stick figure visualization doesn’t match the marker and force plate data, why?
A: The stick figure is based on the joint center locations that are calculated with inverse kinematics calculation of the HBM. For these inverse kinematics calculations, filtered marker data is used. The visualization of the marker and force plate data can be filtered or unfiltered. If the stick figure visualization does not match the visualization of the marker and force plate data, the latter is probably unfiltered. This means that the checkbox: ‘Show filtered markers and forces’ is not checked. This checkbox can be found on the Menu bar: View > Settings > View and is checked by default.
Q: I don’t see any data, what could be wrong?
A: After loading a mox file, make sure that cycles are selected. When there are no cycles selected, there is no data to visualize.
Q: I see outliers in the results, what could be a reason for outliers?
A: Stepping with one foot on both belts might cause an outlier in the results of the kinetics. Outliers in the kinematics can occur if a marker is covered for a short amount of time. In the last case the calculation of the kinematics will use the last known marker position, until the marker reappears again.
Q: How can I create an overlay of previous recording in my report?
A: It is possible to create an overlay in the report which contains data of another recording of the same subject. With this overlay it is possible to compare two (or more) sessions with each other. In order to add a comparison file to the report: File | Compare | Import and select the file you wish to compare to.
Note: A file can only be added as a comparison after it is loaded and saved in GOAT at least once before the file is imported as comparison file.
Q: What do the pink, black and blue lines in the report graphs represent?
A: When a cycle is selected three lines are visible in the report graphs:
- Blue line: This is the current selected gait cycle.
- Pink vertical line: The selected frame in the cycle. This is the moment in the graph that corresponds with the current frames in the 3D window and the video window.
- Black vertical line: Toe-off of the selected cycle.
Q: Can I create and add custom norm data to a GOAT report?
A: Yes. More information can be found in the GOAT Help manual, under GOAT functionalities | Norm data.
Q: How is the stick figure created?
A: The stick figure is based on the joint center locations that are calculated by HBM. Small spheres represent the joint center locations and lines are drawn between the spheres to create the stick figure. More information about the calculations of the joint centers can be found in the HBM reference manual, which can be downloaded from the HBM tab in Post-training.
Editing a GOAT layout file
In this section you can learn how to edit the layout of a GOAT report. This is useful for example, when you need want to add additional graphs or change the position of existing graphs.
 How to edit a GOAT layout file